Industry
Client
Banksalad
Timeline
5 Months
Year
2023
Team
Product Designer(Me), Illustrator(1), Motion Designer(1), Developer(3),
Product Owner(1)
Overview
Goal
What did I work on?
• Designed impactful visual assets including UI graphics, animations, and testing kit packaging to strengthen brand identity and usability.
• Managed design execution and timelines, collaborating closely with motion designers, illustrators, developers, and planners to ensure seamless implementation.
How Can We Create a More Enjoyable Microbiome Testing Experience?
Rather than treating microbiome testing as a clinical process, we reimagined it as an interactive experience, letting users uncover unique traits in a fun and engaging way. To make the process more immersive, we introduced interactive elements that encouraged deeper user participation.

More Details

Making Microbiome Testing More Engaging & Shareable
Identifying Friction Points
The red-highlighted sections in the table show where users lose interest—low adoption, lack of engagement, and harder to share with others. These barriers make it harder for people to discover, use, and talk about the service.
A New Approach: Blending Medical Testing with Tarot-Inspired Interaction
To address these challenges, we introduced a narrative-driven experience:
• Microbes as Guardian Spirits → Instead of clinical data, microbes are framed as protectors of health.
• Tarot-Style Discovery → Users "draw" their microbes, turning the process into a fun and personal journey.
The Impact: A More Engaging & Viral Experience
By combining structured medical testing with an interactive discovery process, we reduced adoption barriers and increased engagement. This new approach makes microbiome testing more immersive, enjoyable and easy to share, transforming health data into something users naturally want to explore and discuss.
More Details

➊ Microbiome Character Card Experience
To make microbiomes more memorable and engaging, we transformed 19 key microbiomes into unique characters.
This approach enhances immersion in microbiome content and turns sensitive health data into a fun and shareable experience on social media.

➋ Clear and Comparative Microorganism Data
We provide microorganism levels along with comparative averages, enabling users to easily see how much they have compared to the average.

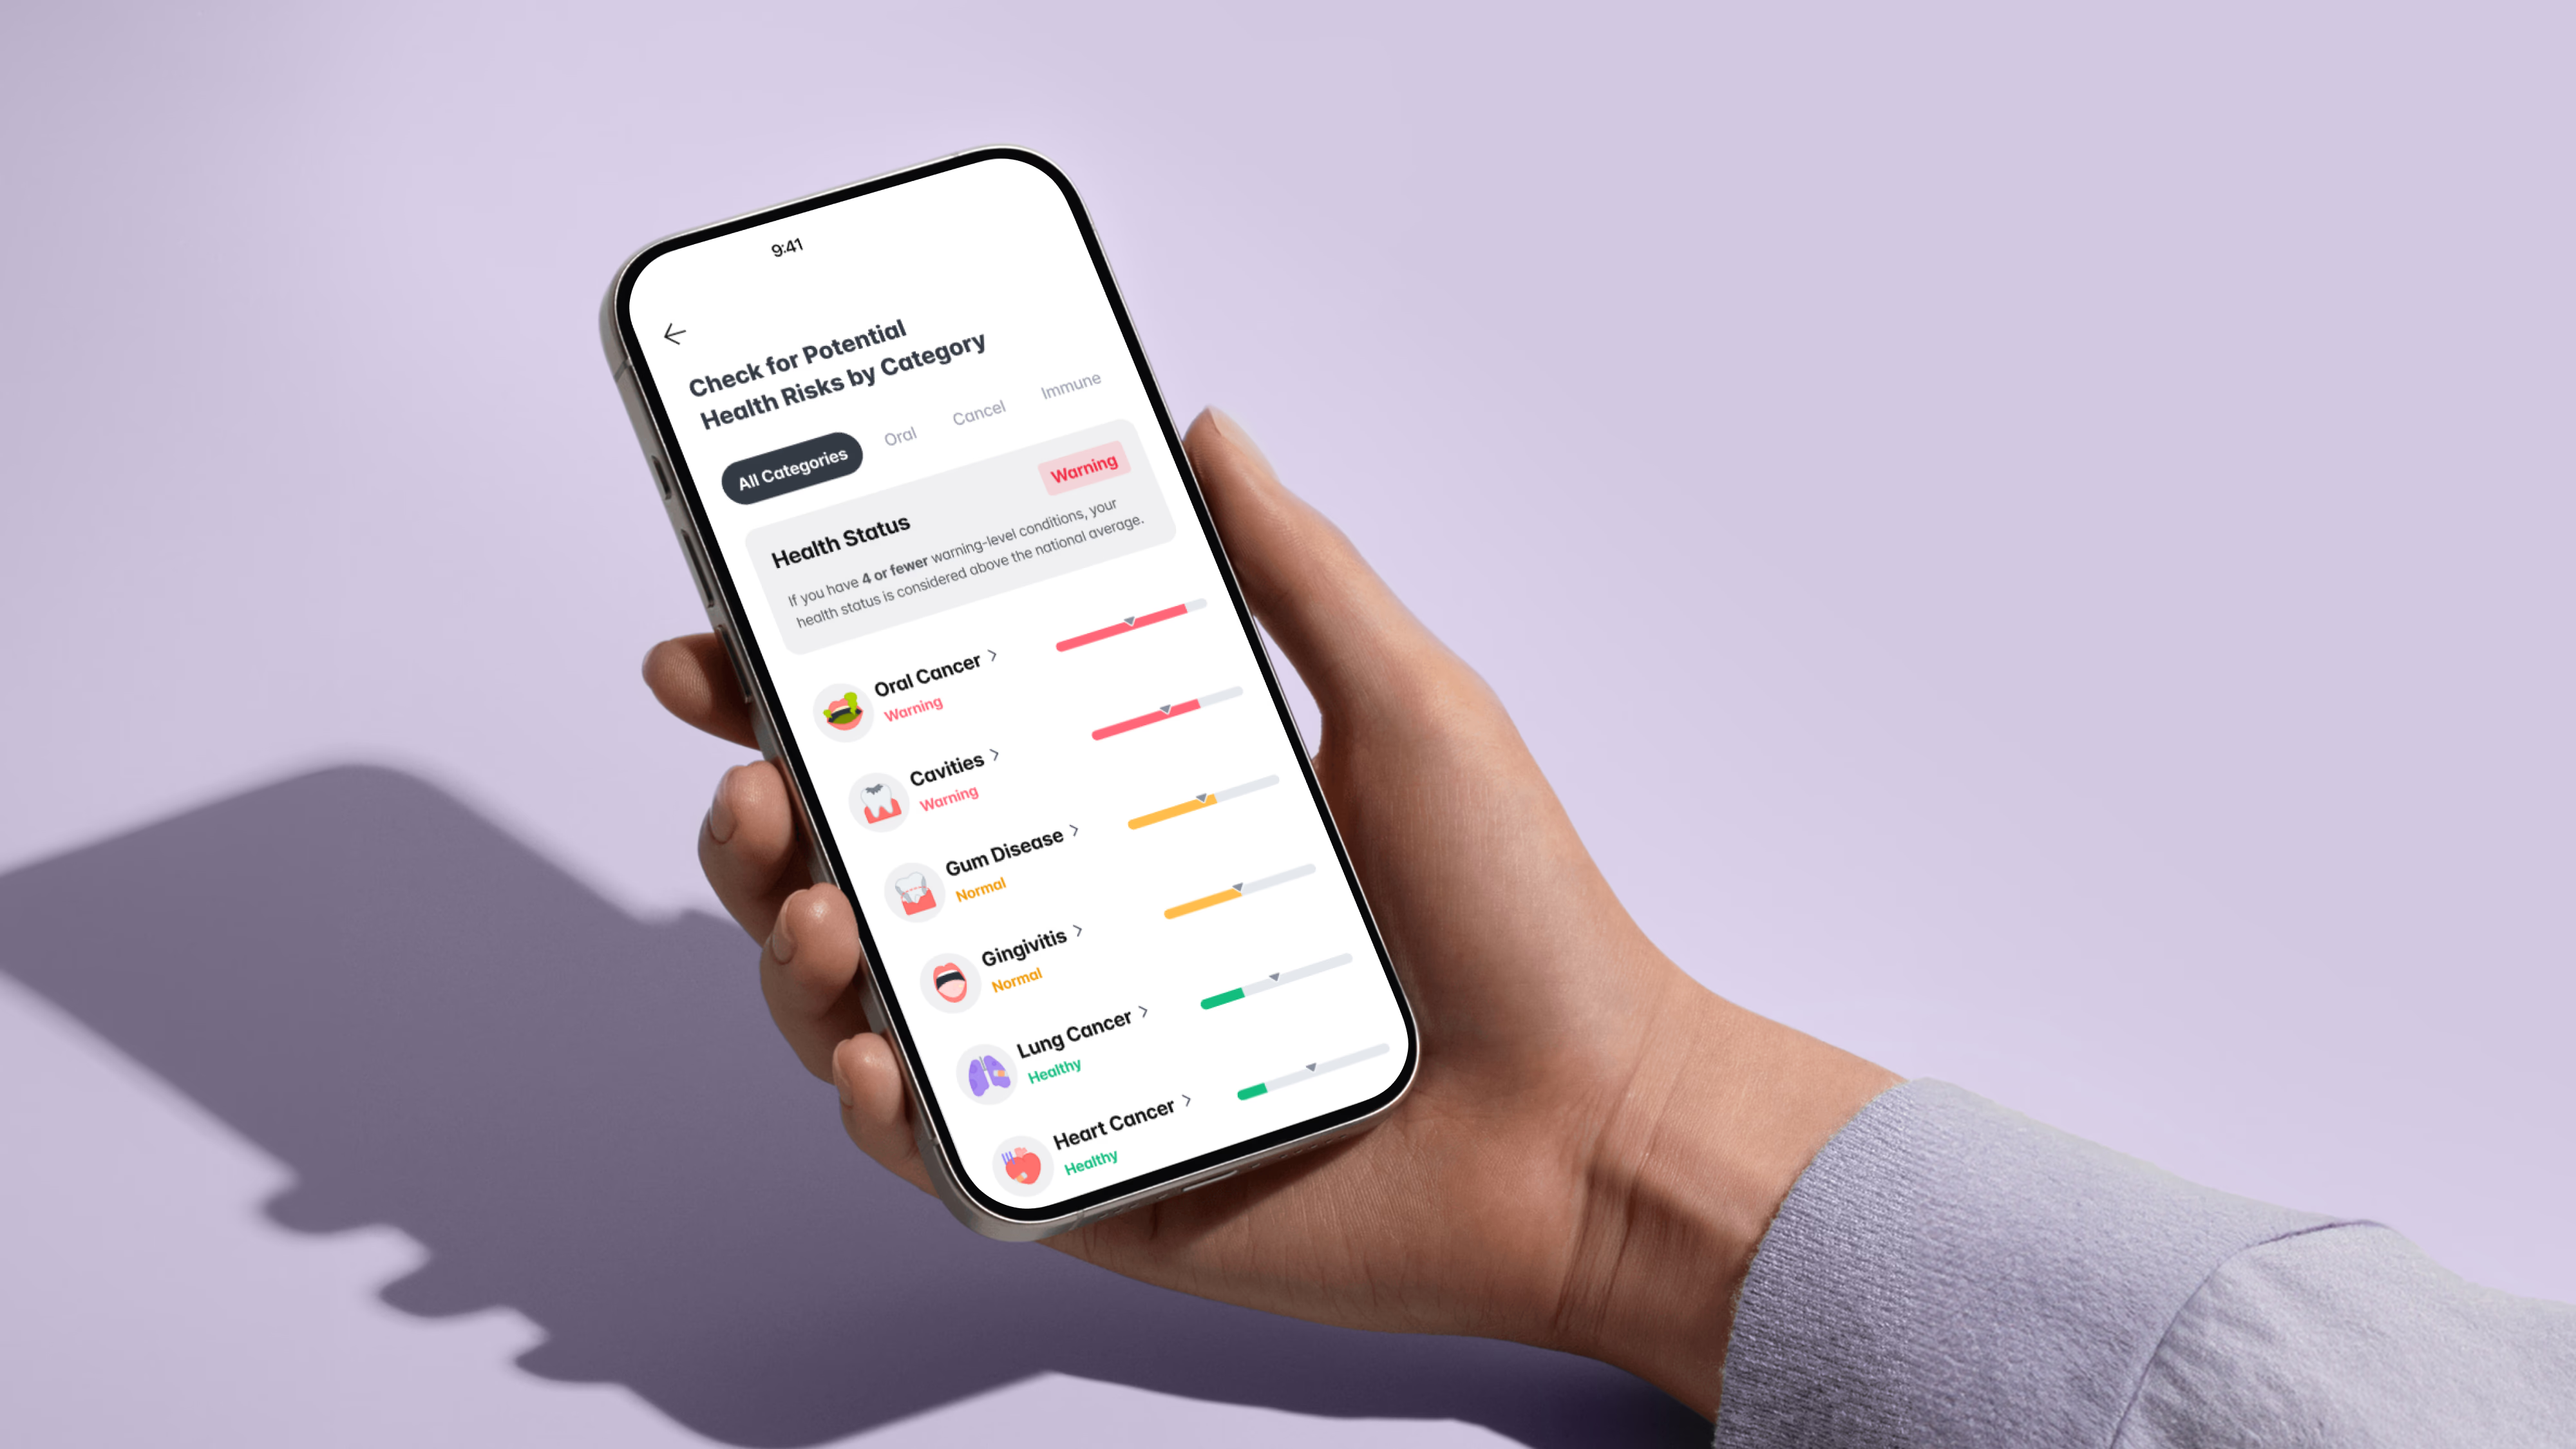
➌ Intuitive Graph Design
We highlight diagnostic badges (Safe, Normal, Warning) based on data, ensuring users can instantly understand the graph. The design remains simple and easy to interpret.

➍ Clear and User-Friendly Terminology
We avoid complex terms and present microbiome information in simple, easy-to-understand language.
For users to see the real value of microbiome testing, they need a smooth transition from fun character interactions to clear and meaningful health insights.
To keep users engaged, I structured the information so they can explore detailed health data naturally without feeling overwhelmed.
More Details

➊ First Impression
• Quick Understanding → Users see key diagnostic insights at a glance, making it easier to focus.
• Encouraging Natural Curiosity → The design sparks curiosity, encouraging users to explore further.

➋ Detailed Explanation
• Building Trust → Showing detailed data right below the summary helps users trust the results and feel more confident.
• Seamless Funnel Navigation → Users quickly understand the key points and are naturally drawn to explore more details.

➌ Visual Content
• Using Visual Cues → Instead of relying on long text, we use visual elements like icons to make health information easier to understand.
A Deeper Look into Our Design Strategy


Key Refinements in the Design Process
Test Application Flow → Structured a streamlined user journey from test request to result delivery.
Promotional Page → Designed an engaging entry point to increase conversions.
Result Review Flow → Optimized how users receive and interpret health insights.